CAEPIDR:
A COMPUTATIONAL APPROACH TO EFFICIENT
PEPTIDE INFLUENCED DRUG REPURPOSING
by
Thomas Francis Long
A thesis
submitted in partial fulfillment
of the requirements for the degree of
Master of Science in Computer Science
Boise State University
December 2014
c 2014
Thomas Francis Long
ALL RIGHTS RESERVED
BOISE STATE UNIVERSITY GRADUATE COLLEGE
DEFENSE COMMITTEE AND FINAL READING APPROVALS
of the thesis submitted by
Thomas Francis Long
Thesis Title: CAEPIDR: A Computational Approach to E cient Peptide Influenced Drug Repurposing
Date of Final Oral Examination: 31 October 2014
The following individuals read and discussed the thesis submitted by student Thomas Francis Long, and they evaluated his presentation and response to questions during the final oral examination. They found that the student passed the final oral examination.
Timothy Andersen, Ph.D. Chair of the Supervisory Committee
Owen McDougal, Ph.D. Member, Supervisory Committee
Amit Jain, Ph.D. Member, Supervisory Committee
The final reading approval of the thesis was granted by Timothy Andersen, Ph.D., Chair of the Supervisory Committee. The thesis was approved for the Graduate College by John R. Pelton, Ph.D., Dean of the Graduate College.
ACKNOWLEDGMENTS
The author wishes to express gratitude to the professors who have helped him during his time at Boise State University. Most notably, Dr. Timothy Andersen, Dr. Amit Jain, and Dr. Owen McDougal. He would also like to thank his companion Kat Dunlevy, whose brilliant mind and dazzling smile have been of great assistance throughout his graduate career.
ABSTRACT
Since the discovery of the molecular basis of disease, numerous studies have reported a correlation between the activity of specific protein receptors and the progression of disease. As a result, drug development has become dependent on the study of protein receptor activities. The relative inexpense of computing hardware has made computational methods an important supplementary tool for receptor modeling. This work details an open source software tool that is capable of both efficiently screening large peptide mutant libraries and enabling 3-D conformer-based searches over local molecular databases. A Computational Approach to Efficient Peptide Inuenced Drug Repurposing (CAEPIDR) has been developed to explore the conformational ligand binding space of the 3 2 nicotinic acetylcholine receptor (nAChR) isoform using a library of conotoxin (-CTx) MII peptide mutants. The screens top hits were used to identify small molecule drugs that might also bind to the receptor. The conformational ligand binding space of the nAChR was heuristically explored using a genetic algorithm, which managed a structure-based virtual screen of a 640,000-CTx MII peptide mutant library. A utility was developed to search the PubChem Compound database for small molecule drugs with a 3-D shape similar to the highest a affinity peptides from the virtual screen. CAEPIDRs genetic algorithm-based procedure was able to nd 10 peptides with estimated free energies of binding (with the 3 2-nAChR) below-20 kcal/mol, which can be compared to-CTx MIIs-12.38 kcal/mol. These peptides were identi ed in spite of the genetic algorithm performing docking calculations for only 9,344 of the 640,000-CTx MII mutants. The PubChem Compound search yielded 2 small molecule drugs with estimated binding energies below-20 kcal/mol. CAEPIDR has been integrated with DockoMatic to create DockoMatic 2.1, which can be used to create virtual peptide mutant libraries, virtually dock ligands to macromolecular receptors, and identify small molecule drugs for disease treatment.
TABLE OF CONTENTS
ABSTRACT………………………………………..
LIST OF TABLES……………………………………
LIST OF FIGURES…………………………………..
LIST OF ABBREVIATIONS ……………………………
1 Introduction………………………………………
1.1 Background . . . . . . . . . . . . . . . . . . . . . . . . . . . . . . . . . . . . . . . . . . . . . .
1.1.1 Drug Re purposing. . . . . . . . . . . . . . . . . . . . . . . . . . . . . . . . . . . .
1.1.2 Molecular Docking . . . . . . . . . . . . . . . . . . . . . . . . . . . . . . . . . . .
1.1.3 High Throughput Virtual Screening . . . . . . . . . . . . . . . . . . . . . .
1.1.4 Docko Matic 2.0. . . . . . . . . . . . . . . . . . . . . . . . . . . . . . . . . . . . . .
1.2 Towards a Drug for Park in sons Disease. . . . . . . . . . . . . . . . . . . . . . . . .
1.2.1 Previous Work. . . . . . . . . . . . . . . . . . . . . . . . . . . . . . . . . . . . . . .
1.3 CAEPIDR . . . . . . . . . . . . . . . . . . . . . . . . . . . . . . . . . . . . . . . . . . . . . . .
2 Genetic Algorithm Managed Peptide Mutant Screening………
2.1 Introduction. . . . . . . . . . . . . . . . . . . . . . . . . . . . . . . . . . . . . . . . . . . . . .
2.1.1 Motivation. . . . . . . . . . . . . . . . . . . . . . . . . . . . . . . . . . . . . . . . . .
2.1.2 Related Work . . . . . . . . . . . . . . . . . . . . . . . . . . . . . . . . . . . . . . .
2.1.3 Genetic Algorithm-Based Searching . . . . . . . . . . . . . . . . . . . . . .
2.2 GAMPMS. . . . . . . . . . . . . . . . . . . . . . . . . . . . . . . . . . . . . . . . . . . . . . . .
2.2.1 Implementation of the Genetic Algorithm. . . . . . . . . . . . . . . . . .
2.3 Validation. . . . . . . . . . . . . . . . . . . . . . . . . . . . . . . . . . . . . . . . . . . . . . . .
2.3.1 Experimental Setup and Evaluation Metrics. . . . . . . . . . . . . . . .
2.3.2 GAMPMS Consistency . . . . . . . . . . . . . . . . . . . . . . . . . . . . . . . .
2.3.3 GAMPMSS cal ability . . . . . . . . . . . . . . . . . . . . . . . . . . . . . . . . .
2.4 AGAMPMS of the 640,000-CTxMII Mutant Ligand Library. . . . . .
2.5 Usage: Screening Peptide Mutants with Docko Matic 2.1. . . . . . . . . . . .
2.5.1 De ning the Peptide Mutant Library . . . . . . . . . . . . . . . . . . . . .
2.5.2 Setting the GAs Parameters. . . . . . . . . . . . . . . . . . . . . . . . . . . .
2.6 Conclusion . . . . . . . . . . . . . . . . . . . . . . . . . . . . . . . . . . . . . . . . . . . . . . .
3 Similarity Search…………………………………..
3.1 Introduction. . . . . . . . . . . . . . . . . . . . . . . . . . . . . . . . . . . . . . . . . . . . . .
3.1.1 Motivation. . . . . . . . . . . . . . . . . . . . . . . . . . . . . . . . . . . . . . . . . .
3.1.2 Similarity Metrics . . . . . . . . . . . . . . . . . . . . . . . . . . . . . . . . . . . .
3.2 Search Model . . . . . . . . . . . . . . . . . . . . . . . . . . . . . . . . . . . . . . . . . . . . .
3.2.1 Map. . . . . . . . . . . . . . . . . . . . . . . . . . . . . . . . . . . . . . . . . . . . . . .
3.2.2 Cluster and Search . . . . . . . . . . . . . . . . . . . . . . . . . . . . . . . . . . .
3.3 Searching Pub Chem Compound. . . . . . . . . . . . . . . . . . . . . . . . . . . . . . .
3.4 Usage: Searching Pub Chem with Sim Searcher. . . . . . . . . . . . . . . . . . . .
3.4.1 Map. . . . . . . . . . . . . . . . . . . . . . . . . . . . . . . . . . . . . . . . . . . . . . .
3.4.2 Cluster . . . . . . . . . . . . . . . . . . . . . . . . . . . . . . . . . . . . . . . . . . . .
3.4.3 Search. . . . . . . . . . . . . . . . . . . . . . . . . . . . . . . . . . . . . . . . . . . . .
3.5 Conclusion . . . . . . . . . . . . . . . . . . . . . . . . . . . . . . . . . . . . . . . . . . . . . . .
4 Conclusions ………………………………………
4.1 Overview of Work. . . . . . . . . . . . . . . . . . . . . . . . . . . . . . . . . . . . . . . . . .
4.2 Future Work. . . . . . . . . . . . . . . . . . . . . . . . . . . . . . . . . . . . . . . . . . . . . .
REFERENCES………………………………………
ADistribution Tests………………………………….
BK-means Clustering ………………………………..
B.1 In-Memory Clustering . . . . . . . . . . . . . . . . . . . . . . . . . . . . . . . . . . . . . .
B.2 Big Data Style . . . . . . . . . . . . . . . . . . . . . . . . . . . . . . . . . . . . . . . . . . . .
CPharmacophore-Based Similarity Metric …………………
LIST OF TABLES
2.1 The640,000 CTxMII mutant library . . . . . . . . . . . . . . . . . . . . . . .
2.2 Screened sub sets of the 640,000 CTxMIImutant library. . . . . . . .
2.3 Top Peptides from the GAMPMS . . . . . . . . . . . . . . . . . . . . . . . . . . . . .
A.1 Distribution Test results. . . . . . . . . . . . . . . . . . . . . . . . . . . . . . . . . . . . .
LIST OF FIGURES
1.1 Primary sequence for-CTx MII with disulfide linkages.. . . . . . . . . . . .
2.1 A possible iteration of GAMPMS. . . . . . . . . . . . . . . . . . . . . . . . . . . . . .
2.2 2 parent,2o spring,2-point cross over. . . . . . . . . . . . . . . . . . . . . . . . . .
2.3 PAM1 mutation matrix. . . . . . . . . . . . . . . . . . . . . . . . . . . . . . . . . . . . .
2.4 Histogram depicting GAMPMSs soundness. . . . . . . . . . . . . . . . . . . . . .
2.5 Histogram depicting GAMPMSs effeciency . . . . . . . . . . . . . . . . . . . . . .
2.6 GAMPMS performance vs available processors . . . . . . . . . . . . . . . . . . .
2.7 The%Docked scores from 10 GAMPMSs of different sized libraries . . .
2.8 Docko Matic 2.1 s main window . . . . . . . . . . . . . . . . . . . . . . . . . . . . . . .
2.9 Docko Matic 2.1s Peptide Mutant Screening wizard,mutable residues. .
2.10Docko Matic 2.1s Peptide Mutant Screeningwizard,mutable constaints
2.11Docko Matic 2.1s Peptide Mutant Screening wizard,GA parameters. . .
3.1 Small molecule drugs with predicted high binding affinity for the 3 2n AChR. . . . . . . . . . . . . . . . . . . . . . . . . . . . . . . . . . . . . . . . . . . . . . . . . .
3.2 The Sim Searcher Window . . . . . . . . . . . . . . . . . . . . . . . . . . . . . . . . . . .
3.3 Sim Searchers Map wizard . . . . . . . . . . . . . . . . . . . . . . . . . . . . . . . . . . .
3.4 Sim Searchers Cluster wizard . . . . . . . . . . . . . . . . . . . . . . . . . . . . . . . . .
3.5 Sim Searchers Query wizard. . . . . . . . . . . . . . . . . . . . . . . . . . . . . . . . . .
A.1 Function to compare distributions using the test arguments . . . . . . . . .
A.2 Code for distribution tests . . . . . . . . . . . . . . . . . . . . . . . . . . . . . . . . . . .
LIST OF ABBREVIATIONS
CID-Compound ID
HTS- High Throughput Screening
HTVS- High Throughput Virtual Screening
NIH- National Institute of Health
GA- Genetic Algorithm-CTx-conotoxin
nAChR -nicotinic acetycholine receptor
pdb- protein databank
sdf- structure data format
CHAPTER 1
INTRODUCTION
1.1 Background
1.1.1 Drug Repurposing
The discovery of the molecular basis of disease has resulted in massive e orts to research and develop new medicines. So far, de novo drug development has followed the general pattern: lead candidate identi cation, prototype development, pre-clinical testing of the model systems, clinical trials, Food and Drug Administration (FDA) approval, clinical deployment, and continued monitoring of efficacy and any side effects associated with long-term use. This process, which has historically yielded a marketable drug for every 10 candidates that make it to clinical trials, has an average cost of $1.2 billion per marketable drug and an average turn around time of 14 years [1, 2]. Reducing these costs is difficult since the majority of the expenses are a result of the clinical trials and cannot be circumvented due to federal safety regulations. In an e ort to reduce development costs, the National Institute of Health (NIH), universities, and pharmaceutical companies have made use of an alternative strategy for drug development: drug repurposing. As the name implies, drug repurposing focuses on the reuse of drugs or small molecules that have already undergone some level of clinical testing. Repurposing allows researchers to build upon previous research and development e orts to expedite and reduce the costs of clinical trials, speeding the drugs review by the FDA and, if approved, integration into health care.
Drug repurposing is either receptor or ligand focused. Receptor-oriented repur posing is an attempt to identify drugs that can be reused to target another receptor or family of receptors (e.g., acetylcholine receptors). Drug databases are searched for small molecules that exhibit a set of characteristics (e.g., structural similarity to a known ligand or to a receptors binding cavity) that makes them likely candidates for binding to the targeted receptor. Many chemical databases have been created to support this type of repurposing.
In contrast, ligand-oriented repurposing focuses on finding a new use for a specific drug. It is a popular approach for pharmaceutical companies since it has the potential to yield a new pharmaceutical without the majority of the expenses associated with drug development. Ligand-oriented repurposing is better known to the general public because of the success of repurposed drugs such as Viagra, Requip, and Colesevelam. The drug repurposing paradigm has had immense success in recent years, ac counting for nearly 30% of the newly (FDA) approved drugs between 1999 and 2008 [3]. This success has been fueled in part by resources, mostly in the form of large chemical databases, that have been made publicly available by both public and private institutions. NIHs PubChem database [4] is a notable example as it contains structural and bioactivity information for over 51 million small molecules. It also includes web-based tools for performing substructure, shape, and many other searches over any of their databases.
1.2.1 Previous Work
Ligand-gated ion channels are a class of membrane-bound receptor proteins that are often involved in cell signalling. These channels are activated or inhibited by ligands: the peptides and other small molecules that bind to the gate to form a complex with the receptor. The specialized role played by these receptors in the regulation of cellular activity has made them a central focus in the fields of biochemistry and pharmacology, where the goal is often to develop small molecule ligands to activate or inhibit biologically relevant receptors.
Many diseases have been correlated with abnormalities in specific cellular activities. For this reason, drug development is largely a search for small molecules that can activate or inhibit the receptor associated with the abnormal activity. As such, predicting the interaction of a small molecule and biological receptor is a central problem in biochemistry and pharmacology. While fast mathematical methods exist for predicting the interaction strength between two bound molecules of a given orientation, accurately predicting the binding orientation of the two molecules (molecular docking) is a complex procedure.
There are two common approaches to molecular docking: simulation and complementary surface modelling. In the complementary surface approach, both the surface area of the receptors complex and the surface area of the ligand are represented as a set of descriptors, which are then compared to predict the binding orientation of the ligand. This assessment is relatively fast but limited in its ability to account for molecular exibility. Complementary surface modelling lends itself to functional group-based comparisons, where the ligands functional groups can serve as its descriptors for the model.
In comparison to the surface modelling approach, simulation is more accurate but has greater computational complexity. In simulations, molecular dynamics techniques are used in tandem with heuristic search methods to explore the orientation binding space for a ligand/receptor pair. All pairwise atomic interactions between the two molecules must be taken into account, subject to the additional degrees of freedom introduced by ligand and receptor exibility. These degrees of freedom produce a huge orientation space, and simulation techniques often use a search heuristic, grid system, and scoring function to identify low energy1 orientations. Within the context of this thesis, the term molecular docking (or just docking) refers to the use of a simulation technique to determine a ligand/receptor pairs binding orientation and the application of a scoring function to assess the pairs binding affinity.
AutoDock
While molecular docking programs abound, AutoDock [5, 6] is the most popular amongst researchers and was cited in 2006 almost as often as the 4 next most cited docking programs combined [7]. AutoDock is a suite of automated docking tools that simplify the task of molecular docking. It consists of two main programs: autogrid for calculating coordinate grids to model the target receptor and autodock for simulating molecular docking within those grids. AutoDock is currently maintained by the Scripps Research Institute and is free under the GNU General Public License. AutoDock uses a Lamarckian Genetic Algorithm to search for a ligand/receptor pairs lowest energy pose. A genetic algorithm (GA) performs an indeterministic search, so multiple GA runs will produce di erent a nity scores for the same lig
1According to the Gibbs energy function
and/receptor pair. As such, researchers who use AutoDock will typically use multiple (100 is standard) GA simulations with different random seeds to more accurately as sess a ligands binding affinity. Since each simulation results in a predicted orientation (pose), groups of AutoDock simulations are also termed pose evaluations.
1.1.3 High Throughput Virtual Screening
Drug development typically involves screening large collections of compounds to identify a small set of compounds that can serve as the starting point for structure optimization and re nement. In high throughput screening (HTS), machine automation is leveraged to rapidly estimate the biochemical activity of large collections of drug-like molecules. A collection of assay plates, containing enclosed wells for storing and isolating chemical entities, is built and lled with a reactant/ reagent pair. After allowing time for the reaction to occur, humans or machine optical devices measure and record the extent of the reaction. The expense of this procedure has made computational methods an important supplementary tool for drug development.
High Throughput Virtual Screening (HTVS) techniques may be categorized as either ligand-based or structure-based depending on the screening criteria. Lig and based techniques are used to identify molecules that are similar to a set of ligands. The throughput of ligand-based methods is dependent on the similarity metric, but it is typically on the scale of thousands of chemicals per second. In contrast, structure based HTVS techniques use molecular docking methods to identify molecules that have a high a nity for the target receptor. Structure-based HTVS techniques are consequently several orders of magnitude slower than their ligand-based counterparts, and a structure-based HTVS usually requires a parallel computing infrastructure to achieve an acceptable throughput. Working with parallel computing infrastructures can require a large learning curve; fortunately, software programs such as WinDock [8], BDT [9], Glide [10], and DockoMatic [11, 12] have been built to facilitate HTVS and make HTVS tools more accessible to researchers who lack computer programming skills.
1.1.4 DockoMatic 2.0
Docko Matic 2.0 is open source software intended for use by researchers and educators. It consists of an intuitive graphical interface and a Perl script that uses the scripts from the Auto Dock Tools package to set up and run batches of docking jobs
with Auto Dock. In addition to single ligand/receptor docking, DockoMatic enables secondary ligand binding and structure-based HTVS. Ligands and receptors are input as protein database (pdb) les and the experimentally determined or predicted ligand binding domain on the receptor is speci ed with a grid coordinates le (gpf). Dock oMatic is capable of submitting and subsequently monitoring hundreds of thousands of AutoDock jobs.
DockoMatic has the ability to generate a peptides structure from an amino acid sequence and using the Obconformer program (part of the Open Babel tool suite [13]) for the structures energy optimization. Dockomatic 2.0 includes the Treepack [14, 15] program, allowing in silico site-directed mutagenesis for complex peptide and protein structures using experimentally determined tertiary structure. As a result, a library of mutated peptides can be screened without manually generating the peptides mutated structure; Treepack handles that on the y. This greatly reduces the work associated with screening large collections of peptide mutants, an attribute of Docko Matic that has been leveraged in this thesis.
1.2 Towards a Drug for Parkinsons Disease
Epidemiological studies have demonstrated an inverse relationship between the development of neurodegenerative disorders and smoking [16, 17, 18], decreased levels of nicotinic receptors in postmortem studies of persons who had been a icted with forms of dementia [19], and nicotines ability to improve cognitive function in animals (including humans) [20]. These results have led many researchers to hypothesize that nicotinic receptors serve an important role in both neuronal survival and cognitive function [21]. This hypothesis has made nicotinic acetylcholine receptors (nAChRs), which are the primary targets for nicotine in the brain, a central focus for researchers interested in studying neurodegenerative disorders such as Parkinsons disease.
In addition to nicotine,-conotoxins have been extensively studied as ligands for nAChRs. Conotoxins are one of a group of neurotoxin peptides that have been isolated from the venom of the marine cone snails of genus Conus. They are small peptides, consisting of 10-30 amino acid residues, and usually contain one or more disulfide bonds.-conotoxins have received a lot of attention because, unlike nicotine, they have been found to selectively block speci c nAChR subtypes. This has made them an important tool for probing the structure-function relationships of nAChRs.
1.2.1 Previous Work
Dr. Owen McDougal and his research team have been investigating-CTx MII, a 16 amino acid peptide that exhibits an IC50 of 0.5 nM for the nAChR 3 2 is o form [22].-CTx MII has a primary sequence of GCCSNPVCHLEHSNLC, contains two disulfide bonds between C2-C8 and C3-C16, and features an-helix initiated at P6 and ending at S13 (see Figure 1.1). Site-directed mutagenesis studies on nAChRs, investigations into the alteration of the primary sequence of-CTx MII, and molecular modeling approaches have all been conducted to understand the selectivity and potency of-CTx MII and its variants [23, 24, 25]. Notably, the results of a study by Bordia and colleagues showed the E11A mutant of the-CTx MII peptide demonstrated a 50-fold binding preference for the 6 4 2 3-nAChR isoform [26].
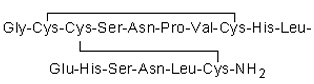
Figure 1.1: Primary sequence for-CTx MII with disul de linkages.
The findings of these studies motivated the team to develop a drug repurposing work ow that could be used to identify strong candidates for pharmaceuticals to treat Parkinsons disease. The work ow was:
Peptide Mutant Screening
Perform a structure-based HTVS of an-CTx MII mutant library to find peptides with high binding affinity for the 3 2-nAChR.
Search PubChem
Compound Use these peptide structures to perform a ligand
based HTVS of the PubChem Compound database and identify FDA approved drugs with 3-D conformers similar to the high a nity peptides.
Veri cation Screening
Perform molecular docking calculations between the resulting small molecule drugs and the 3 2-nAChR.
Synthesize
Purchase or synthesize the highest a nity small molecules.
Wet Lab Use lab-
based experiments, such as the two electrode voltage clamp experiment, to con rm that the predicted binding a nity translates to biological activity.
Extension
Usethedeveloped work owtostudy the more biologically relevant nAChR 6 4 2 3-isoform in order to develop a drug to treat Parkinsons disease.
As the rst step in the work ow, the team decided to perform an in silico combinatorial chemistry experiment-based on the-CTx MII peptide. They constructed a library of-CTx MII mutants and wanted to use structure-based HTVS methods
to identify peptides with a high binding a nity to the 3 2-nAChR. A pentameric homology model of the 3 2 isoform of rat neuronal nAChR [27] was used for the initial experiment since it was the best available expression of a nAChR. Citing studies that identi ed the importance of the disul de bonds in maintaining a rigid structure and the-helix initiated by proline in restricting the peptides length, the team decided to conserve the C2, C3, P6, C8, and C16 residues during their simulation.
The plan was to allow the mutation of all other residues subject to the constraint that a residues polarity and/or charge be conserved. That is, the polar and/or charged S4, N5, H9, E11, H12, S13, and N14 residues could mutate into polar and/or charged amino acids and the nonpolar G1, V7, L10, and L15 residues could mutate into nonpolar amino acids (excluding proline). However, the resulting mutation space consisted of an intractable 80 billion (84 117) peptides. To make the experiment tractable, the mutable residues were reduced to N5, H9, L10, E11, H12, and L15 and mutation into C was excluded. This reduced the mutation space to a collection of 640,000 (82 104) peptides. The HTVS capabilities of DockoMatic 2.0 were to be used to investigate the library.
Peptides are rarely used as pharmaceuticals since most are rapidly inactivated by gastrointestinal enzymes. As such, the second step in the work ow was using the top hits from the rst step as the structural basis of a ligand-based HTVS of the
PubChem Compound database. The PubChem project contains an online tool for searching any of the PubChem databases. The team planned to use the online tool to perform a 3-D shape-based similarity search against the top-CTx MII mutants. Molecular docking calculations would be performed to predict the binding a nity (to the 3 2-nAChR) of the identi ed small molecules. Lab-based techniques could then be used to verify the computational predictions, and the entire work ow could be used to probe the more biologically relevant nAChR 6 4 2 3-isoform in order to identify drugs for treating Parkinsons disease.
1.3 CAEPIDR
CAEPIDR was developed to facilitate the experiment described in Section 1.2. Following experimental validation, the software that was developed for the 3 2-nAChR experiment was generalized and incorporated into DockoMatic. The resulting pro gram, DockoMatic 2.1, is a powerful tool for exploring a receptors conformational binding space with peptide mutation and identifying small molecule drugs for disease treatment.
In total, this thesis represents 4 major contributions to the eld of biochemistry. First, the identi cation of small molecule drugs with a high binding a nity to the nAChR 3 2-isoform. Second, GAMPMS, a model for e ciently and accurately searching a peptides mutation space for receptor binding a nity. Third, a procedure for performing fast 3-D shape-based similarity searches over molecular databases. Last, an extension to DockoMatic that includes an implementation of the GAMPMS model and the 3-D shape-based search procedure. The body of this thesis has been divided into 2 chapters. Chapter 2 details the Genetic Algorithm Managed Peptide Mutant Screening (GAMPMS) model, which was developed to increase the throughput of DockoMatics virtual screening process when screening peptide mutant libraries. The general model, as well as an implementation of it, are explained and experimental results are shown that demonstrate its soundness. A GAMPMS of the 640,000-CTx MII peptide mutant library was performed, in ful llment of the work ow from Section 1.2, and is described. The results of the search are also presented. The chapter ends with a usage case of DockoMatic 2.1, demonstrating how to use the integrated GAMPMS program. PubChems online search tool does not work with small peptides such as the CTx MII peptide mutants, and an alternative tool was needed to search the database. Chapter 3 details the procedure used to search a local copy of the PubChem Compound database. The procedure is presented in the form of several pseudo-code algorithms with accompanying textual explanations. The PubChem Compound database search, for small molecules that were structurally similar to the-CTx MII mutants, is described and the identi ed small molecules are presented. The chapter ends with a usage case of DockoMatic 2.1, demonstrating the use of the SimSearcher tool. Sim Searcher can be used to quickly search local molecular databases (sdf format) for structurally similar 3-D conformers.
CHAPTER 2
GENETIC ALGORITHM MANAGED PEPTIDE
MUTANT SCREENING
2.1 Introduction
2.1.1 Motivation
DockoMatic 2.0 facilitates the screening of large peptide mutant libraries by enabling the following work ow: enumerate the peptide ligands in a le, enter the receptor and specify its binding domain as a set of grid coordinates, select the number of GA runs to be used in AutoDock simulations, and submit the jobs to run on a server. However, the simultaneous submission of hundreds of thousands of jobs is likely to overload the clusters scheduler and upset its administrators. In practice, screening a large library with DockoMatic 2.0 requires the user to partition the library and submit each partition separately, usually after some of the previously submitted jobs have completed. Since most users of DockoMatic 2.0 are not expected to have scripting skills, this procedure is not viable for large libraries.
Even with a script to monitor job submissions, performing molecular docking calculations for hundreds of thousands of ligands is computationally expensive. For example, using AutoDock 4.0 to simulate the binding of each of the 640,000-CTx
MII mutants on a 122 core cluster1 (using 100 GA runs) would require:
1. 2 years to complete
2. 737 Terabytes of storage
3. 5246 partitions (for user submission)
assuming that each pose evaluation would requires 2 minutes to complete. For many reasons, perhaps the most important of which is the inability of most re searchers to access a large quantity of computing power for a long period of time, these
requirements made the experiment intractable. An alternative method was needed to reduce the time and computational requirements. To address these problems, we asked the following question:
How can the-CTx MII mutant library be screened in less time, with less computational resources, and without the need for human supervision?
One solution that immediately presented itself was to reduce the number of pose evaluations per ligand. This would result in a proportionate reduction in the time and storage requirements for the screening. However, using only a few pose evaluations would still require 5,246 submissions and would undermine the accuracy of the study.
2.1.2 Related Work
Generally applicable HTVS techniques exist that can greatly increase the throughput of virtual screenings. Typically, these approaches use machine learning algorithms to predict the binding a nity of new compounds. The a nity of docked ligands is used
1The size of the Computer Science Departments in house (beowulf) cluster at Boise State
University
to train the algorithms. Once trained, the algorithms are several orders of magnitude faster than molecular docking techniques. As such, they can be used to screen huge libraries that would be intractable to screen with traditional docking methods. In one such approach, molecular docking techniques are used to assess the binding affinity of a subset of a compound library. The docking results are then used to train a random forest algorithm which is used to predict the binding affinity of the librarys remaining compounds [28]. Using this approach, Plewczynski was able to nd 60% of the active compounds for a protein target when docking only 10% of the library. Random forests have been shown to compare favorably to other methods for screening molecular databases [29, 30]. Cherkasov et al. took a similar approach but built a QSAR regression model instead of a random forest. The QSAR was then used to predict the binding a nity for new compounds based on their 2D descriptors [31, 32]. The approach was able to reduce the time required for the screening of a 90,000 compoundlibrary (of potential human sex hormone-binding globulin (SHBG) binders) by 40% while nding 4 structures that were SHBG binders with high micromolar a nities. Different regression models, decision trees, neural networks, and many other classi ers from machine learning have been used to a similar e ect. Ma [33] and Melville et al. [34] have both surveyed applications of machine learning classifiers within the eld of HTVS, and the interested reader is encouraged to review their work for a more detailed treatment of the subject. A genetic algorithm (GA) is another popular machine learning technique that has found application in computational and combinatorial chemistry. Sheridan et al. [35, 36] have used a GA to construct a library of synthesized oligomers from large sets of simple chemical fragments. The GA was used to optimize the diversity of the librarys members with the assumption that maximum structural diversity would
2.1.3 Genetic Algorithm-Based Searching
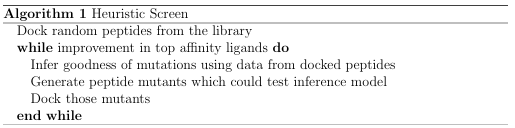
While machine learning algorithms can be used in place of traditional docking methods in order to increase the throughput of a screen, they are less accurate. Additionally, the score that is assigned by a custom implementation (using a unique training set) of a machine learning algorithm to a ligand/receptor binding is rather meaningless in the context of a scienti c community. In contrast, reporting an AutoDock score is useful since anyone can use AutoDock and attempt to replicate the reported results. Ultimately, an unsupervised algorithm was needed that could use the results of previous docking jobs to make an informed decision as to which mutations would increase the peptides binding a nity and which would decrease it. Algorithm 1 illustrates the essential characteristics of the desired model, which can be implemented
effectively with a GA.
AGAisanon-deterministic, iterative search heuristic that uses techniques derived from natural evolution to search for an optimal solution to a given problem. A GA searches by rst randomly generating a collection (population) of hypotheses (individuals) and then iteratively deriving a new population from the current one. A
new population is built by applying a set of operators, known as genetic operators, to the members of the current population. Common genetic operators include: mutation, where individuals experience slight alterations; crossover, where pieces of the best known individuals are recombined to form new individuals; and selection, where individuals meeting some criteria are transferred to the next population. Central to GAs is the ability to assess the goodness ( tness) of an individual. In the case of molecular screening, the tness of a ligand is likely to be directly proportional to its binding affinity with a target receptor. A GA continually derives new populations until some stopping criteria is met: typically when a set number of iterations have occurred or there is stagnation in the fitness of the top individuals.
A genetic algorithm can be used to perform a heuristic HTVS of a peptide mutant library, reducing the time and computing resources required for the screening without the need for algorithm training.
The Genetic Algorithm Managed Peptide Mutant Screening (GAMPMS) model was built to demonstrate the soundness of this hypothesis. In the GAMPMS model, a GA manages a structure-based HTVS of a collection of peptide mutants. The GA iteratively docks small collections of compounds and uses the binding affinities of previously docked compounds, in tandem with techniques derived from natural evolution, to select compounds for subsequent docking calculations. This approach compares favorably to other machine learning methods, when screening large peptide mutant libraries, since it does not require training. The GA handles job submission and monitoring, allowing researchers to focus instead on setting up the next phase of the study.
2.2 GAMPMS
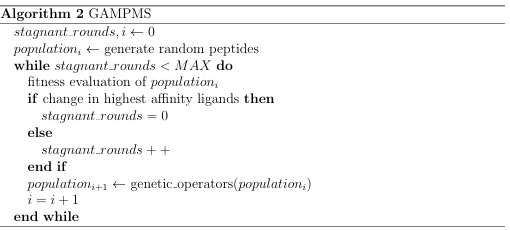
The GAMPMS model is shown in Algorithm 2, and a possible iteration is illustrated in Figure 2.1. As mentioned previously, the GAMPMS model uses a genetic algorithm to iteratively dock small collections of compounds (populations).
Every population has the same number of peptides whose binding affinity with the target receptor is unknown, so a constant number of docking jobs are submitted at the beginning of each iteration. The GAMPMS model is therefore self-throttling, requiring no submission management on behalf of the user. In GAMPMS, peptide mutant libraries are de ned as a base peptide and a set of mutation constraints. Mutation constraints specify which residues are subject to mutation (mutable) and which amino acids can be substituted for each mutable
residue. As an example, the 640,000 1.2 is defined in Table 2.1. CTx MII mutant ligand library from Section
Table 2.1: The 640,000 CTx MII mutant ligand library de ned as a base peptide and a set of mutation constraints.
To be consistent with the GA terminology from before, peptide mutant screening is envisioned as an optimization problem. An individual is a sequence of amino acids such that there is one amino acid associated with each mutable residue in the peptide mutant librarys definition. The goal of a peptide mutant screening is to find an individual that, when the individuals amino acids are substituted for the base peptides mutable residues, results in a peptide with an optimal binding affinity with the target receptor.
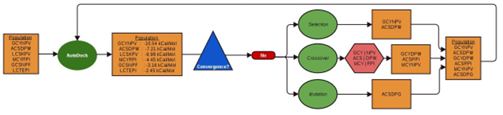
Figure 2.1: A possible iteration of GAMPMS
2.2.1 Implementation of the Genetic Algorithm
Representation of an Individual
In the GA that was integrated into DockoMatic 2.1, each individual (peptide mutant) is represented as the sequence of amino acids that are substituted for the base peptides mutable residues. Since the base peptide is assumed to be the same for all mutants, it is not necessary to incorporate it into the representation. Using the single letter amino acid symbols, each individual can be represented as a character array.
Fitness Evaluation
In DockoMatics GAMPMS implementation, evaluating the tness of an individual is a two-step process. In the rst step, a pdb le is built for each individual by submitting the individuals set of mutations, along with the base peptide, to the Treepack program. In the second step, the pdb le is used as the ligand for a molecular docking simulation against the target receptor. AutoDock is used to dock the ligand against the target receptor, and the Gibbs energy of the highest affinity pose is considered the tness value for the individual. The number of pose evaluations to be used in each AutoDock simulation is con gurable.
Genetic Operators
Three genetic operators are used in DockoMatic 2.1s GA.
Elitism
The first operator is elitism: a special case of the more general selection operator. As previously mentioned, the selection operator selects individuals, based on some user-de ned criteria, to be carried over to the successive population. In the case
of elitism, that criteria is fitness ranking within the population. In DockoMatic 2.1, the elitism operator selects the top elite factor 100% of a populations individuals and adds them to the successive population.
Crossover
The second genetic operator is two parent, two o spring N-point crossover using a fitness proportionate selection scheme. The implemented two parent, two o spring N-point crossover occurs in three steps. First, a selection scheme is used to chose two individuals (the parents) from the current population. Since a fitness proportionate selection scheme is used, the probability of an individual being chosen is directly proportional to its fitness ranking within the population. In the second step, a set of N indices are chosen from within a parents range ([1 individual length]) and both parents are split into N + 1 pieces according to the indices. Finally, the pieces from both parents are combined, in an alternating fashion, to make two di erent o spring that share features of both parents. Figure 2.2 shows an example of two parent, two o spring, 2-point crossover.
In Docko Matics implementation, the indices de ning the splits are chosen randomly for each pair of parents. The number of indices (N) is con gurable but defaults to N = individual length 2 . Recall that individual length is the number of mutable residues in the peptide mutant librarys definition.
Mutation
The nal genetic operator is mutation, a process whereby each amino acid in an individuals sequence has a small chance of being replaced by a different amino acid from the substitution set of the associated mutable residue. Two versions of the mutation operator were implemented. In the first version, the probability of
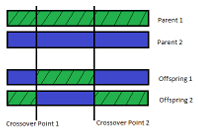
Figure 2.2: A pictorial representation of 2 parent, 2 o spring, 2-point crossover. Two
individuals from the current population are split into pieces and those pieces are reassembled, in an alternating fashion, into 2 new individuals.
an amino acid being replaced by another amino acid was proportional to the historic probability of such a mutation occurring. The historic probabilities were derived from the PAM 1 mutation matrix (see Figure 2.3). In the second version, an amino acid had an equal chance of changing into any of the other amino acids in the associated residues substitution set. The di erent versions were used in multiple screens of a known a nity peptide mutant library (see Section 2.3). It was found that the uniform mutation technique had a (statistically insigni cant) lower average number of docking calculations for a screening that found similar a nity ligands. Due to its relative simplicity, uniform mutation is used in DockoMatic 2.1s GA. In DockoMatic 2.1, the user can specify the mutation rate, which is the probability that any amino acid is altered during the mutation operation.
Terminating Condition
A genetic algorithm iteratively builds new populations, using a set of genetic operations, until some criteria is met (see Algorithm 2). In DockoMatic 2.1, the genetic algorithm stops generating new populations when there has been no change in the
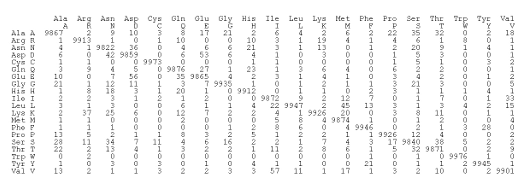
Figure 2.3: The PAM 1 mutation matrix. The number at coordinates rowcol represents the average number of times that the amino acid row has mutated into the amino acid col for every 10,000 mutations that have been identified.
top X highest a nity peptides over the last iterations. Intuitively, using larger values will increase the probability of nding the highest a nity ligands in the library, whereas using lower values will reduce the screenings run time. The values of both top X and are con gurable.
Parameters
In review, the behavior of the GA is parameterized with 5 numeric values, representing:
elitism factor : the percent of the populations top individuals that are carried over to the successive population.
mutation rate : the probability of a mutation occurring within an individual. top X : the number of optimal peptide mutants to identify.
: the population size.
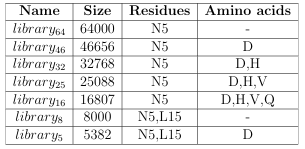
Table 2.2: Additional constraints were added to the 640,000 CTx MII mutant library in order to create smaller libraries. This table lists, for a speci c library, the residues that were no longer deemed mutable and the amino acids that were no longer substitutable.
: the GA stops after iterations of no change in the top top X individuals.
= 50 and top X = 10 were used as the default values in the experiments in section 2.3. The following notation is used to list the additional parameter values for a GAMPMS experiment: elitism factormutation rate }
2.3 Validation
For proof of concept, the GAMPMS implementation was used to screen libraries of CTxMII mutants for binding a nity towards the 3 2 isoform of rat neuronal nAChR. Each library was a subset of the 640,000 Section 1.2; the libraries are defined in Table 2.2. CTxMII mutant library from
The most important subset was the 64,000 mutant library (library64) resulting from the removal of N5 from the set of mutable residues. Since it was small enough to screen exhaustively but large enough to yield interesting results, it was used for most of the experiments in this section.
2.3.1 Experimental Setup and Evaluation Metrics
The soundness of GAMPMS was assessed by comparing its results to those of an exhaustive, structure-based HTVS (i.e., molecular docking calculations were per formed for each compound) of the same library. The binding energy of the top hits and the number of docking calculations performed were the focus of the assessment. Comparison of the number of docking calculations was straightforward; every peptide was docked with the exhaustive approach whereas only a fraction of them were docked with GAMPMS. The number of docking calculations performed by a GAMPMS is reported as a percent of the librarys cardinality, denoted %Docked. Comparison of the binding a nity of the top hits is a little more complicated. We define xrs as the summation of the binding energy, against receptor r, of the x best peptides identi ed by a HTVS s. The similarity in binding a nity between a GAMPMS and an exhaustive screening is measured as:
%Affinity = xrGAMPMS by xr exhaustive.
All %Affinity scores in the current study use x = 10 and r = 3 2 nAChR. AutoDock 4.0 was used, with 30 pose evaluations per docking (i.e., ga runs = 30), for the exhaustive, structure-based HTVS of library64 against the 3 2 nAChR model. A tness map, which associated a peptide to its highest a nity score from AutoDock, was constructed from the HTVS results and used as the tness function for each GAMPMS mentioned below. This map allowed a GAMPMS to run in a fraction of a second and removed the inconsistency from AutoDock scoring.2 The results of a GA are dependent on the values of its parameters (e.g., mutation rate, elite factor, , etc.) and the pseudo-random numbers generated during the crossover
2If a ligand is given a different fitness score in each screening, it can be di cult to compare the results of those screenings.
and mutation operators. As such, a meaningful assessment of GAMPMS required multiple screenings of each library. A given GAMPMS, identi ed by the library screened and the parameter values used, was repeated multiple times to isolate the
variance resulting from the random number generator. We report the results of 1910 GAMPMSs of library64 and 10 GAMPMSs of each of the smaller libraries. The fitness map from above served as the basis of the comparison between a GAMPMSs identi ed peptides and those that would have been identi ed by an exhaustive screening.
2.3.2 GAMPMS Consistency
The consistency of GAMPMS, as it relates to the %Affinity and %Docked scores, was assessed with 300 independent GAMPMSs of library64. For 100 of the experiments, the set of parameter values 2 022 was used to produce low %Docked
scores. The more general set of parameter values 2 0512 was used for an additional 100 experiments. The last 100 experiments were run with a set of parameter values, 3 0825 , selected to yield a high %Affinity score. The results are captured by the histograms in Figures 2.4 and 2.5. Figure 2.4 shows the frequency of %Affinity scores across the 300 experiments, whereas Figure 2.5 shows the frequency of %Docked scores across the same experiments. In both of these gures, the height of bar[i] represents the fraction of GAMPMSs that resulted in a score x : bar[i] x bar[i 1]. The exception to this rule is bar[0], whose height represents the fraction of GAMPMSs that resulted in a score x : x bar[0]. For perspective, 100 screens were performed by docking 5,700 (the largest number of peptides docked during the 300 experiments from above) random members of library64. This random sampling resulted in a mean %Affinity score of 91.7 ( = 13).
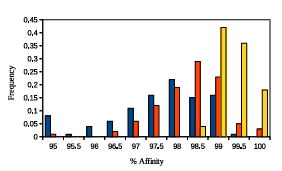
Figure 2.4: A histogram representing GAMPMSs soundness when screening
library64. The height of a bar represents the frequency of the range of %Affinity
scores. The blue bars summarize the data from 100 experiments with low % Docked
parameter values, the yellow bars summarize the data from 100 experiments with high %A nity parameter values, and the orange bars summarize the data from 100 experiments with more neutral parameter values. The lowest recorded %Affinity score across all 300 screens was 94.05.
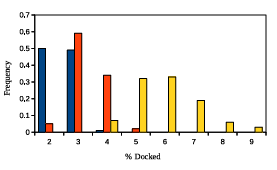
Figure 2.5: GAMPMSs e ciency when screening library64. The x-axis shows the percent of the library that was docked and the y-axis shows the associated frequency. The color scheme is the same as detailed in Figure 2.4.
Figures 2.4 and 2.5 demonstrate that GAMPMS can consistently find some of the highest affinity ligands while performing docking calculations for a relatively small number of the peptides. Moreover, the results indicate that the variance in performance can be tuned with a single parameter. Specifically, increasing had the effect of decreasing the variance in the %Affinity scores and decreasing had the effect of decreasing the variance in the %Docked scores.
2.3.3 GAMPMS Scalability
vs Performance
To assess how the GAMPMS implementation scaled with population size, , 1,600 independent GAMPMSs of library64 were performed. The value of for every 100 screens. The parameter values was changed 25 05 900 were used for all 1,600 GAMPMSs. The %Docked score and the number of iterations required for convergence were recorded and are displayed in Figure 2.6. The time required to apply the genetic operators, submit docking jobs, and parse the fitness values is insigni cant compared to the time required for the molecular docking simulations. As a result, the approximate run time of a GAMPMS can be expressed with Rquation 2.1.
timetotal = iterations*[ timejob*|p| by available cores (2.1)
where timejob is the amount of time required to dock a ligand to a receptor with AutoDock.3
3This time is dependent on the number of pose evaluations being used; 1-3 minutes per pose evaluation depending on your systems speed.
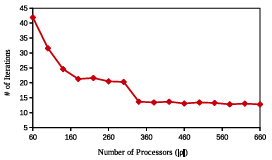
Figure 2.6: GAMPMSs performance measures based on the number of processing cores used, . The y-axis shows the number of iterations (submissions) needed for a GAMPMS to converge. Each diamond represents the mean value, for the associated , from 100 GAMPMSs of library64.
It can been seen from Equation 2.1 that the lowest run time can be achieved by choosing the population size, , to be less than or equal to the number of available processing cores. In this case, all docking jobs can be run in parallel. Selecting a larger value of | p| will at least double the run time of the screen.
Library Size
To approximate how the %Docked score scales with larger libraries, library 64, library 46, library 32, library 25, library 16, library 8, and library 5 were each screened 10 times with the GAMPM Simple mentation. Each screening used the same set of parameter values: = 30 topX = 5 and 2 045 . The %Docked score from each GAMPMS was plotted and is shown in Figure 2.7. The inverse relationship between the size of a library and the %Docked score indicates that the number of docking jobs required for a GAMPMS increases more
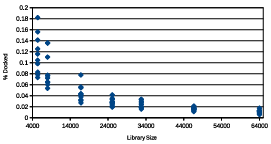
Figure 2.7: The %Docked scores from 10 GAMPMSs of di erent sized libraries. Each diamond represents a %Docked score.
slowly than does the cardinality of the compound library. So the average %Docked score for a GAMPMS scales very well with library size. It is also interesting to note the negative correlation between the variance in the %Docked scores and the size of the library. If the trend holds for larger libraries, it might be possible to accurately predict the number of iterations required for the screening to complete.
2.4 A GAMPMS of the 640,000-CTx MII Mutant Ligand Library
The GAMPMS implementation was used to screen the 640,000-CTx MII mutant library for binding a nity to the 3 2 nAChR. The results from Section 2.3 were used to identify a set of parameter values that would yield peptides with a relatively high
binding affinity without requiring more than a week to run. The GA was con gured to mutate one in every 50 amino acids, carryover the top 40% of each population, use two parent, two o spring, 3-point crossover, and attempt to identify a set of 50
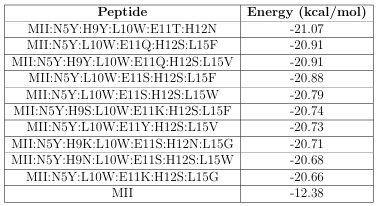
Table 2.3: The 10 highest a nity peptides found with a GAMPMS, the base peptide (-CTx MII), and their associated Gibbs free energy of binding.
optimal peptides. The GA terminated after it went 5 rounds without an improvement in the binding energy of the 50 top peptides.
The screening was performed using 128 cores on Idaho National Laboratorys (INLs) Fission cluster.4 40 pose evaluations were used in the AutoDock docking simulation for a ligand/receptor binding. Had DockoMatic 2.0 been used for the
HTVS, it would have required 5,000 submissions (of 128 AutoDock jobs) and roughly 292 days. Instead, the GAMPMS implementation submitted 73 groups of 128 jobs (for a total of 9,344 molecular docking jobs) and nished in 4 days and 6 hours. The 10 highest a nity mutants identi ed by GAMPMS, as well as the-CTx MII peptide (for reference), are shown in Table 2.3.
4The screening was funded as part of the Idaho University Consortium
2.5 Usage: Screening Peptide Mutants with DockoMatic 2.1
A work ow has been included in DockoMatic 2.1 to facilitate the screening of large peptide mutant libraries. The work ow is illustrated here by walking through the setup of a GAMPMS of the 640,000-CTx MII library from Section 1.2. To screen a peptide mutant library, DockoMatic 2.1 must be loaded and the receptors pdb and gpf le, the output directory, and the ligands (base peptides) pdb le must be entered in the associated elds. The number of AutoDock cycles (pose evaluations) must be speci ed, as well as any special options for the swarm utility. When these steps are completed, the Mutation Screening check box can be marked to bring up the peptide mutant screening wizard (thewizard). Figure 2.8 shows what DockoMatics main window looks like when setting up a GAMPMS of an-CTx MII (MII) mutant library against the 3 2 nAChR (A3B2 2br8). the wizard was designed to simplify the process of de ning the peptide mutant library and, if desired, to con gure the genetic algorithm to be used for a GAMPMS of the defined library.
2.5.1 Defining the Peptide Mutant Library
Recall that a peptide mutant library can be defined as a base peptide and a set of mutation constraints, which specify the mutable residues and the amino acids that can be substituted for each mutable residue. The base peptide is input as the ligand in Docko Matics main screen, and the mutation constraints are specified in the first two steps of thewizard. In the rst step, residues belonging to the base peptide are selected for mutation. In the second step, a set of amino acids is associated with each of the mutable residues.
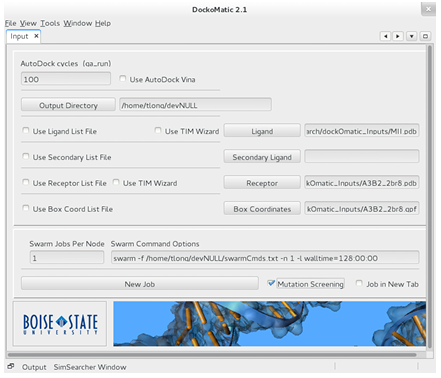
Figure 2.8: The main window component of DockoMatic 2.1. To screen a peptide mutant library, the user needs to input the necessary data les and then select the Mutation Screening option, which has been highlighted in red in the picture.
Mutable Residues
When thewizard is rst loaded, the base peptides amino acid sequence is parsed from the pdb le and displayed as a list of residues. Residues are deemed mutable if they are selected in the list. One can use the standard multiselect and range select
features (respectively, CTRL + click and select first, hold SHIFT, select last) to select residues for mutation. The Go To button is useful when dealing with a larger base peptide (more residues). The button can be used to center the list on a certain
residue (enter its index and click Go To ) or on the next type of residue (enter the single letter representation for the amino acid and hit Go To ). For convenience, the currently selected residues will be displayed at the bottom of the screen. To setup the GAMPMS for the the 640,000-CTx MII mutant library from Section 1.2, hold down the CTRL button, click the N5, H9, L10, E11, H12, and L15 residues, and then click Next. Figure 2.9 shows the completed step before clicking Next.
Mutation Constraints
Once the mutable residues have been selected, a peptide mutant library can be defined by constraining the mutation of each mutable residue. This is achieved by entering a substitution set for each mutable residue. One speci es a mutable
residues substitution set by selecting the mutable residue from the top list, selecting the substitution set from the lower list (using the same list features described above), and then hitting the Bind Constraints button. The same substitution set can be easily assigned to multiple residues by multiselecting from the residue list. Figure 2.10 shows the nonpolar residue substitution set selection for the 640,000-CTx MII
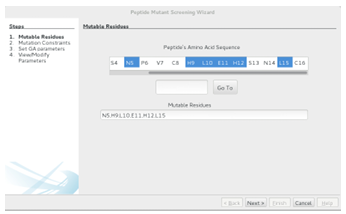
Figure 2.9: The rst step in the Peptide Mutant Screening wizard. The user selects residues from the base peptide that can be mutated during the experiment. The Go To button can be used to focus the list on an acid type or index. Clicking the Next button goes to the Mutation Constraints screen.
mutant library.
A peptide mutant library has been fully defined when a substitution set has been selected for each mutable residue. Clicking Finish returns the user to the main Docko Matic screen, where they can perform an exhaustive structure-based screen of
the library by clicking the New Job button. Alternatively, clicking the Next button allows the user to con gure a GA for a GAMPMS of the library.
2.5.2 Setting the GAs Parameters
Con guring a GAMPMS requires specifying , top X, and the desired balance between the opposing goals of minimizing the number of docking calculations required for the screening and maximizing the estimated binding strength of the resulting ligands. The population size, , determines the number of molecular docking jobs
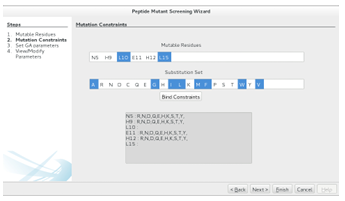
Figure 2.10: The second step in the Peptide Mutant Screening wizard. The user assigns a substitution set to each mutable residues by selecting the relevant list elements and hitting the Bind Constraints button. The resulting library can be screened exhaustively (Finish ) or with a GAMPMS implementation (Next ).
that will be submitted at each iteration. To minimize the time required for a GAMPMS, should not exceed the number of processors that can be dedicated to the screening. As mentioned in Section 2.2.1, the GAMPMS process ends when
there has been no change in the top X highest a nity ligands in the last rounds. Thus, the value of top X a ects both the number of iterations that will be generated and the cardinality of the optimized result set.
In Section 2.2.1, it was shown that a GAs performance can be con gured by specifying values for genetic operators parameters and the termination condition. However, part of DockoMatics purpose is to make molecular docking tools accessible to students. It is assumed that DockoMatic 2.1 users will be unfamiliar with GAs and thus unable to con gure a GAs parameters to meet their screening goals. So instead of inputting numeric values for unfamiliar parameters, a novice user tells the wizard
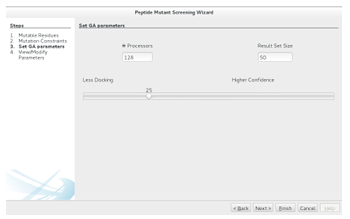
Figure 2.11: Con guring a GAMPMS requires setting the population size, top X (Result Set Size), and the sliding bars position. The remaining parameters are generated automatically based on these 3 values. The generated values can be viewed/modi ed by clicking Next, or the GAMPMS can be instantiated by clicking Finish.
how to weigh the opposing goals of minimizing the number of docking calculations required for the screening and maximizing the estimated binding strength of the resulting ligands. This is achieved by adjusting thewizard s sliding bar (see Figure 2.11). Appropriate values for elitism factor mutation rate and are generated automatically.
When all 3 values have been input, the generated parameter values can be viewed and/or modified by clicking Next. Alternatively, the GA can be instantiated by clicking Finish. Clicking the New Job button from the main DockoMatic screen
will start a GAMPMS of the defined library.
2.6 Conclusion
GAMPMS uses a genetic algorithm to manage a structure-based high throughput virtual screening of a peptide mutant library. It is capable of reducing the number of molecular docking calculations required to screen a 640,000 peptide library by roughly 98.5% while nding ligands with high binding a nity with the target receptor. Its performance is easily con gurable, allowing the user to prioritize the number of docking calculations performed or the binding a nity of the identi ed peptides. GAMPMS scales well with the size of the peptide mutant library, exhibiting an inverse relationship between the size of the library being screened and the percent of the librarys compounds that need to be docked. GAMPMS has the advantage of signi cantly reducing the number of docking calculations required for structure-based HTVS.
In comparison to other approaches, GAMPMS does not require training or any form of human supervision. Instead, GAMPMSiteratively docks populations of mutants using evolutionary techniques and the binding energies of previously docked mutants to select compounds for subsequent docking simulations. The types of libraries that can be screened with GAMPMS are limited to combinatorial libraries such as those that result from mutating a molecule. As with most other non-trivial heuristic searches, there is no guarantee that a GAMPMS will nd the highest a nity ligand from a library. The integration of the GAMPMS model into DockoMatic 2.1 represents an important extension to the suites investigative potential.
CHAPTER 3
SIMILARITY SEARCH
3.1 Introduction
3.1.1 Motivation
Receptor-driven drug repurposing typically involves a ligand-based HTVS of small molecule databases. Many small molecule databases exist, including DrugBank, Pub Chem, BindingDB, ChemSpider, and the Beilstein and Gmelin databases (available through Reaxys), which provide web-based tools for performing substructure and molecular similarity searches. However, each database uses a different interface and different algorithms for their search. This can be problematic when one wishes to perform a specific type of search over a database that contains the necessary data but not the tools.
Having identified a set of peptides with a high-binding affinity to the target receptor, the next step in the work ow (described in Section 1.2) was the identification of small molecule drugs that closely resembled the 3-D shape of the-CTx MII mutant ligands. This was to be achieved using PubChems online search tools. The tools are accessible free of charge, courtesy of the NIH, and can be used to search any of the PubChem databases. The compound structure similarity search was identified as the most appropriate for our experiment. The 200 highest a nity-CTx MII mutants
from the GAMPMS were used as input for the search. However, it was discovered that PubChems 3D search, which is geared towards small, drug-like molecules, can only generate a model for compounds containing less than 16 rotatable bonds. The CTx MII mutants had at least 20 rotatable bonds, and as a result the tool failed to generate a model for any of them. An alternative means of searching PubChem was needed.
While there are many chemical databases, PubChem is arguably the most useful for drug repurposing. It contains patent information, bioassay results, bioactivity data, and structural information for over 51 million small molecules, including drugs that have already been approved by the FDA.1 For these reasons, searching PubChem was a vital part of the research project.
Pub Chem provides an FTP service for downloading their Compound database, but the question remained:
How can a local copy of the PubChem database be quickly searched for molecules that are similar to our small peptides?
First, a means of assessing similarity was needed. PubChem 3D uses volume overlay techniques to compare each molecule in the database to a set of (a few thousand) structurally diverse reference molecules. A binary ngerprint is then constructed for each molecule by associating a bit with every reference molecule. If a reference molecule is similar to a molecule, the corresponding bit is set. When all the molecules have a ngerprint, the similarity between molecules is quickly assessed using the Tanimoto coe cient (shown in Equation 3.1) to compare their binary ngerprints.
1Although all 4 types of information are not available for all molecules
Tanimoto = AB by A+B AB (3.1)
where A and B are the counts of ngerprint set bits in the molecule pair (respectively) and AB is the count of bits in common. Generating the ngerprint for every molecule is a computationally demanding endeavor, but they can be precomputed in an completely parallel manner. PubChem 3D used this technique to reduce the search time by two orders of magnitude [43].
However, we did not want to spend months determining reference shapes and generating ngerprints in order to search the database a few times. A different technique was needed to assess similarity within the database.
3.1.2 Similarity Metrics
Ligand-based HTVS must use a similarity metric that is easy to compute (or at least precomputable) and discriminative. Since ligand-based HTVSs are often used to discover ligands with similar bioactivity, without needing to perform expensive
molecular docking calculations, similarity metrics account for ligand characteristics that are thought to be important in determining binding properties. Metrics are broadly classi ed as structure or (pharmacophore) feature based, although some metrics handle both. Structure-based metrics assess the shape of a molecule using the molecules 2-D or 3-D coordinates. Graph comparison techniques such as Maximum Common Subgraphs [44, 45] and graph kernels [46, 47], regression models such as the Quantitative Structure-Activity relationship (QSAR) model [48], and volume overlay techniques are commonly used to assess molecular similarity [49]. Feature-based metrics focus on the presence and location of chemical features (e.g., hydrogen donors and acceptors, ring centers, and charged atoms) that are needed to trigger a biological response from a specific biological target. QSAR and graph techniques, which work well with a descriptor-based representation, can also be used to assess feature-based similarity.
The size of chemical databases (terabytes) often necessitates the use of molecular signatures: compact, trivially comparable entities that encapsulate a molecules relevant features. Using signatures divides the work of searching into two steps:
signature generation and signature comparison. Signatures are typically designed to transfer complexity from the comparison aspect and into the generation aspect. Since signatures can be precomputed, search times are typically much faster when signatures are used. PubChem 3D uses binary ngerprints, which require computationally demanding volume overlay techniques to generate, as a molecules signature.
3.2 Search Model
It was hypothesized that a shape distribution technique [50] could be used to assess 3-D shape similarity between molecules. With a shape distribution technique, a shape sampling function is used to construct a distribution of measurements. The distribution serves as the molecules signature and a distribution difference measure, such as the 2 test, is used to quickly compare the signatures. While distribution tests are fast, performing 51 million of them can take a sub stantial amount of time. Multilevel K-means clustering provided a sound method for decreasing search time since it would allow a recursive search operation to compare the target molecule with a subset of the clusters. This would reduce the number of comparisons required and therefore the searchs run time.
A model was devised to allow quick similarity searches, with any target molecule, over local molecular databases. For clarity, using a molecule M as the basis of a similarity search (i.e., searching with a target molecule M) over a database D is equivalent to searching D for items that are similar to M. The model consisted of three steps:
Map
Map all molecules to signatures.
Cluster
Cluster the signatures for quicker searching.
Search
Map the target molecule to a signature and search the (clustered) database for similiar signatures.
Map must occur rst to make a search tractable. The Cluster step is optional but highly recommended because of its ability to reduce search time by a few orders of magnitude. The Map and Cluster steps are computationally expensive but only
need to be performed once per database and can be pre-computed. Search is the end product of the process, allowing users to quickly perform molecular similarity searches over the database.
3.2.1 Map
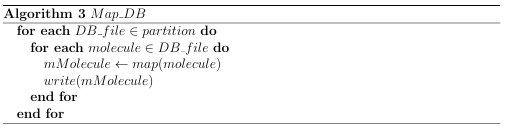
Generating signatures is an embarrassingly parallel problem, which is made even simpler by the fact that molecular databases are typically downloaded as a collection of data les. To quickly generate signatures, it is necessary to rst partition the database les to create a partition for each available processing core. Then, using a function (map()) to generate a signature for a molecule, an instance of the Map DB algorithm (Algorithm 3) can be run on each processor in order to generate signatures
for the associated partition. The important work in the Map step occurs in the function map().
map() is responsible for generating a molecules signature (mapping a molecule to a signature). The signature needs to be both descriptive and easily comparable so that a similarity metric can be discriminative and e cient, respectively. Signatures can be pre-computed, making the computational complexity of their generation less important than that of the similarity metric.
Shape Similarity
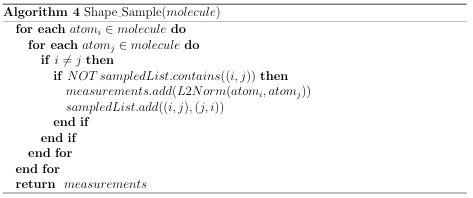
The shape distribution approach described in Section 3.3 was used to gauge the 3-D shape similarity of two molecules. In this approach, a shape sampling function is applied to a 3-D shape in order to attain a set of measurements. The distribution of these measurements is used as the shapes signature. Any distribution difference test (e.g., 2) can be applied to the two signatures to quickly judge the similarity of the associated molecules. This approach has been successfully applied to the comparison of 3-D protein structures [51]. The implemented shape sampling function measures the euclidean distance between unique pairs of atoms within a molecule. The amount of computation needed for sampling is con gured by defining the number of samples to take. Since most of the molecules within PubChem Compound are small (less than 50 atoms), it was feasible to generate a distribution using all N(N+1) 2 measurements (N is the number of atoms in the molecule). unique
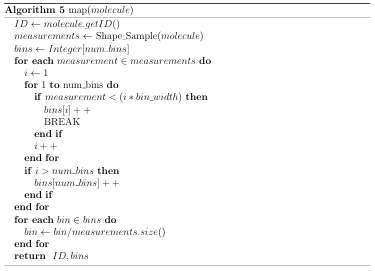
A distribution is represented as a histogram containing a constant number of bins and a maximum measurement threshold. Algorithms 4 and 5 demonstrate the process used to create a molecules shape signature. Algorithm 5 is used as map()
in Algorithm 3 to generate shape signatures for a group of data les. Four similarity metrics were implemented for signature comparison: Chi Square, L1 norm, L2 norm, and the Root of Products test. These distribution tests are described in Appendix A.
3.2.2 Cluster and Search
Clustering is an optional step, although it is highly recommended for shape-based similarity searches. Without clustering, searching a database with molecule q re quires comparing the signature of q to every signature in the database. For the Pub Chem database, this would mean performing 51 million calculations. Clustering the signatures can reduce the number of similarity calculations by a few orders of magnitude.
Let us imagine dealing with a database containing DBsignatures. If the database is clustered with the K-means algorithm, where K = k1 k2 search could be performed with
![]() (3.2)
(3.2)
similarity calculations by comparing the target molecule to each of the K cluster centers and then to each of the DB K signatures within the cluster whose signature was most similar to the target molecule. If DB K, a single K-means clustering
would reduce the number of comparisons by a factor of K. Nested (multilevel) clustering can be used to further reduce search time. In multilevel clustering, most clusters contain subclusters. Algorithm 6 gives a pseudo code algorithm for the idea, with a user calling NlevelCluster(NDB) to perform N level clustering with the K-Means clustering algorithm. A Big Data implementation of the K-means clustering algorithm was used for generating the two outermost clusters, whereas an in-memory implementation was used for subsequent clusters. Both of these implementations are discussed in Appendix B.
If the DB database is clustered with n-level clustering, where level i has ki clusters (recall K = k1 k2 kn from above), then the approximate number of similarity calculations required for an effective search is given by:
(3.3)
As aresult, the di erence in the number of required signature calculations between the n-level clustering and the single clustering is given by:

(3.4)
So if DB= 50 million and K = 20 20 20 = 8000, then multilevel clustering can reduce the search time by 65%, compared to a single K-means clustering. The idea used in the single level cluster search can be easily extended to handle nested clusters. Algorithm 7 shows a recursive technique that can search a collection of signatures that have been subjected to N-level clustering.2 To search with the target molecule q, one would call Search(qDB).
2 including 0-level & 1-level clustering
3.3 Searching PubChem Compound
PubChems FTP tool3 was used to download the most diverse conformer for each molecule in the PubChem Compound database. The SDF directory contained 2,864 sdf les, with each covering a range of 25,000 Compound ID numbers (CIDs). For various reasons, many hundreds of thousands of compounds have been removed from Pub Chem since its creation, so there are gaps in the CID sequence and each sdf le contains data for less than 25,000 molecules. The 2,864 sdf les, which required 300 GB of storage, were stored on INLs servers.
Shape distributions (signatures) were created for the downloaded molecules. The Euclidean distance between all the unique atomic pairings within a molecule was used to sample the 3-D shape of the molecules. The distances were binned to create a histogram distribution. Each histogram contained 10 bins and each bin had a width of 1.5 units. Distances greater than 15 units were placed in the last bin. The 2,864 sdf files were divided into 16 groups of 179 les and signatures were generated for each group in parallel. This required 3 hours and produced a signature le corresponding to each sdf file.
Searching the signature database with a single peptide required 24 minutes. To reduce the search time, the signatures were clustered using multilevel K-means clustering. During clustering, the 2 test was used to assess the distance between signatures. As a result of the clustering, the signatures were divided into 50 clusters, where each of those clusters contained 20 subclusters and each of those clusters contained 5 subsubclusters.
The clustered signature database was queried with the top 200 peptides from the
3get ftp://ftp.ncbi.nih.gov/pubchem/Compound 3D/01 conf per cmpd/SDF/*
GAMPMS described in Section 2.4. When querying the database, the 2 test was used to compare the peptide to the center of each of the 50 outermost clusters. The cluster whose center was closest to the peptide, and all clusters whose centers had
a similarity score (with the peptide) within .01 of that score, were searched. The same process occurred with the 20 subclusters contained in each searched cluster, and again with the 5 subsubclusters contained in each searched subcluster. When a subsubcluster was searched, the peptide was compared to each signature in that cluster. In this manner, the 100 molecules that were most similar to a peptide were identified in a few seconds with only a few thousand distribution tests.
Duplicate molecules and those containing inorganic elements such as silicon were removed from the 20,000 small molecule collection, leaving 1,320 small molecules.
Each of these small molecules was docked against the 3 2 nAChR model using AutoDock with 40 pose evaluations. To identify only distinct sca olds, the 1,320 molecules were clustered and the molecule with the highest binding a nity with the
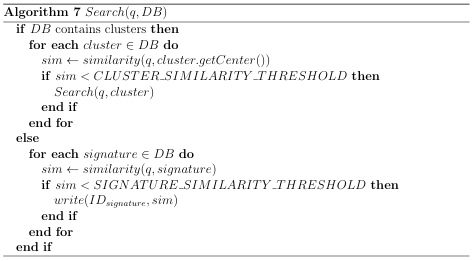
3 2 nAChR was selected from each cluster. In this manner, 128 molecules were identified. The 12 highest a nity molecules from the set of 128 are shown in Figure 3.1.
3.4 Usage: Searching PubChem with Sim Searcher
The SimSearcher tool has been implemented in DockoMatic 2.1 to perform quick similarity searches over local molecular databases. In this section, SimSearcher is demonstrated by walking through the mapping, clustering, and searching of the Pub Chem Compound database. The PubChem Compound database, which was already downloaded for the experiment in Section 3.3, was stored in the PubChemData folder.
(a) CID 10349665 (b) CID 11017883 (c) CID 11479396
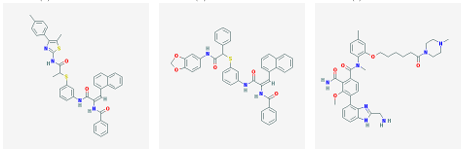
(d) CID 19303596 (e) CID 19311642 (f) CID 22012526
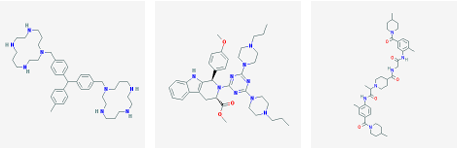
(g) CID 25131416 (h) CID 46702076 (i) CID 50197859
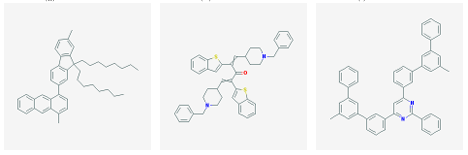
(j) CID 23590164 (k) CID 54426994 (l) CID 57872389
Figure 1: 2 dimensional structures
1
Figure 3.1: Small molecule drugs with predicted high binding a nity for the 3 2 nAChR.
Figure 3.2: The user interface for the SimSearcher program. To run any step of the program (i.e., map, cluster, search), a user clicks the associated button. Output is displayed in the area above the buttons
3.4.1 Map
The Map wizard is used to map the databases molecules to a database of shape signatures. A user clicks the Map button at the bottom of the Sim Searcher window (see Figure 3.2) to start the wizard. In the Mapping wizard, one must specify the molecular database, the output folder (where to put the signature database), the type of signature to generate, and the submission parameters. For the demonstration, the PubChemData folder is used as the database directory and the Pub Chem Signatures folder as the output directory. Shape distributions are selected for use as the signatures (the pharma cophore signature is discussed in Appendix C) and the default values are used. These values were chosen by building histograms for a subset of the PubChem Compound database with the goal of minimizing the number of empty or almost empty bins. Finally, one tells the program to divide the work across X processes and to run Y processes per node. Once again, the swarm utility is used to submit jobs to the cluster scheduler. Figure
3.3 shows the completed wizard for the example, using X = 12 and Y = 4. Clicking the Finish button will submit the jobs to the scheduler.
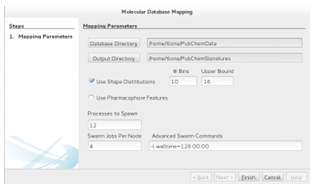
Figure 3.3: The interface for the Map program. A user points the program to the molecular database and speci es the type of signature to generate as well as the submission parameters (swarm parameters and the number of processes to spawn).
3.4.2 Cluster
The Cluster button can be clicked, from the SimSearcher window, to load the Cluster wizard, which allows up to 3 levels of clustering to be performed. With the Cluster wizard, one specifies the mapped (signature) directory, the output directory, the distribution test to use when assessing signature similarity (during K-means clustering), the number of clusters to generate at each level, and the submission parameters. For the demonstration, the PubChemSignatures (mapped) database is used and the output is sent to the ClusteredDB directory. The 2 distribution test is selected to be used when comparing signatures. The number of clusters (the K in K-means clustering) to generate at each level is then entered. To use 2 (or 1) level clustering, one can specify 0 for the number of clusters at level 3 (and 2). Finally, one tells the program to divide the work across X processes and run Y processes per node. Figure
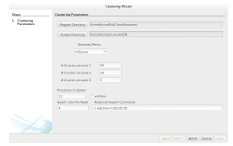
Figure 3.4: The interface for the Cluster program. A user points the program to the
signature database and speci es what similarity metric to use, how many clusters to generate at each level, and what parameters to use for submission (swarm parameters
and the number of processes to spawn).
3.4 shows the completed wizard from the example, with X = 12 and Y = 4. Clicking the Finish button will submit the clustering jobs to the scheduler
3.4.3 Search
Searching the molecular database is the end goal of the process. The Search button is used to load the Search wizard, which allows a search of a (clustered) signature database. With the Search wizard, one specifies the signature database to be searched, the target molecule (as an sdf file), the similarity test to use, and the number of similar molecules to identify. The search is run on the local machine.
For the demonstration, the ClusteredDB is searched for the 10 molecules most similar to the rst compound in PubChem 3D (the compound with CID = 1). The 2 test is selected to be used to assess signature similarity. The completed wizard for this step is shown in Figure 3.5. Upon clicking Finish, DockoMatic 2.1 will parse the target molecule (CID 1) from the sdf le and generate a signature for it. It will
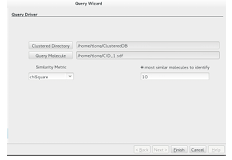
Figure 3.5: The interface for the Search program. A user points the program to a database of molecular signatures and speci es the target molecule and the number of similar molecules to identify.
then use Algorithm 7 to locate the most similar signatures and output the ID and similarity score associated with the 10 most similar signatures.
One can search the database with a set of target molecules by submitting a .txt file as the Query Target. The text le should contain the path to each query targets sdf file, with one path per line.
For comparison, both Pub Chem Signatures and Clustered DB were searched with a single target molecule (CID = 1) for the 10 most similar molecules. The Pub Chem Signatures search took a little more than 24 minutes to complete and
performed 51 million similarity calculations. In comparison, the Clustered DB search required a few seconds, performed 15000 similarity calculations, and found the same 10 molecules.
3.5 Conclusion
The development of additional signature types and corresponding similarity metrics could increase SimSearchers utility. A pharmacophore-based signature and corresponding similarity metric have been developed (see Appendix C) and are included in DockoMatic 2.1, but pharmacophore clustering is not supported. Work remains to be done to improve the speed and test the accuracy of the developed pharmacophore based similarity search.
Once a molecular database has been mapped to a signature database, the molecular database can be deleted. If a researcher wishes to learn more about a molecule (e.g., the one that was most similar to a target molecule), he or she can use the ID
to locate its information from the online database. This prevents researchers from having to allocate hundreds of gigabytes of memory to store redundant molecular information.
In summary, a model has been devised to allow quick similarity searches over local molecular databases with any target molecule. The model consists of 3 steps: Map, Cluster, and Search. In the Map step, signatures are generated for the databases molecules. In the Cluster step, N-level K-means clustering of the signature database is performed to reduce the number of comparisons needed for a search. Each of these steps needs to be performed once per database per signature type. In the Search step, a recursive search algorithm is used to locate signatures similar to the target molecule(s). The ID for the identi ed molecules are output, allowing the user to search the original web database for additional information on the molecule. The model has been implemented and integrated with DockoMatic 2.1.
CHAPTER 4
CONCLUSIONS
4.1 Overview of Work
CAEPIDR was developed to explore the conformational ligand-binding space of the 3 2nAChRisoform and use the results to identify small molecule drugs that target the receptor. A GA-based search procedure (GAMPMS) was used to heuristically
explore the ligand-binding domain of the 3 2 nAChR isoform using a 640,000-CTx MII mutant library. The GAMPMS required only 9,344 docking calculations and identified peptides with estimated binding a nities 70% higher than the original-CTx MII peptide. In CAEPIDRs repurposing step, the PubChem Compound database was searched for molecules bearing a shape similar to the highest a nity-CTx MII mutants. To perform the search with small peptides, the database was downloaded and the shape distribution based signatures were generated for each molecule. The signatures were clustered using multilevel K-means clustering and searched with the peptide mutants.
The estimated binding a nities of the identi ed small molecules varied, but the top molecules predicted a nity was 70% higher than that of the-CTx MII peptide. Some of the top identi ed small molecules, which are shown in Figure 3.1, are being purchased from a vendor to provide additional validation for the approach. CAEPIDR has been generalized and integrated with DockoMatic. DockoMatic 2.1 contains an intuitive graphical interface for a peptide mutant screening work ow, allowing a researcher to quickly create virtual peptide mutant libraries. The user has the option to screen the peptide mutant library exhaustively or with an implementation of GAMPMS. DockoMatic 2.1 also contains the SimSearcher module,
which facilitates the mapping, clustering, and searching of local molecular databases.
Searching a clustered database with SimSearcher requires a few seconds per target molecule, and a list of target molecules can be submitted to facilitate larger searches. As a result, Docko Matic is a powerful tool for researchers interested in the drug repurposing model. Docko Matic is an open source software tool and is available for download on source forge.net.
4.2 Future Work
At this point, the first 3 steps of the work ow from Section 1.2 had been completed. The 128 identi ed small molecules are promising candidates for repurposing to target the 3 2-nAChR and treat Parkinsons disease. However, much work remains to be done before any of these drugs can be tested for treating Parkinsons disease. For example, Lipinskis rule of 5, that can be used to remove candidates which have a high chance of failing clinical trails, can be applied to lter the set of molecules. Once a narrowed set is speci ed, members of that set must be purchased or synthesized and tested in a lab setting to con rm the predictions of the computational methods. However, these procedures are beyond the scope of this thesis; the 128 molecules represent this thesismain contribution to the project.
The Sim Searcher utility can be improved through additional experimentation to discover better default values for the shape distribution based signatures. Ad ditionally, pharmacophore features can be integrated into the signatures in order
to improve SimSearchers ability to identify molecules with similar bioactivity. A pharmacophore-based metric has been implemented (see Appendix C) and has been tested for e ectiveness. Its performance (see Table A.1 from Appendix A) was
equivalent to that of the Chi-Square test. Unfortunately, this made it useless as a complementary metric. Work remains to be done to modify the metric so that it is capable of complimenting the shape distribution approach, which would give researchers a better approximation for bioactivity similarity.
REFERENCES
[1] Therapeutic Development Process.(2014). Retrieved, August 6, 2014 from http://www.ncats.nih.gov/research/reengineering/process.html
[2] DiMasi, J.A., Hansen, R.W., Grabowski, H.G. The price of innovation: new estimates of drug development costs. Journal of Health Economics 22 (2003) 151-185.
[3] Jin, G., Wong, T.C. Toward better drug repositioning: prioritizing and integrating existing methods into e cient pipelines. Drug Discovery Today, Volume 00, Number 00, January 2014.
[4] Bolton, E., Wang, Y., Thiessen, P.A., Bryant, S.H. PubChem: Integrated Platform of Small Molecules and Biological Activities. Chapter 12 IN Annual Reports in Computational Chemistry, Volume 4, American Chemical Society,
Washington, DC, 2008 Apr.
[5] Morris, G.M., Goodsell, D.S., Halliday, R.S., Huey, R., Hart, W.E., et al. (1998) Automated Docking Using a Lamarckian Genetic Algorithm and an Empirical Binding Free Energy Function. J Comput Chem 19: 1639.
[6] Goodsell, D.S., Olson, A.J. (1990) Automated docking of substrates to proteins by simulated annealing. Proteins 8: 195-202.
[7] Sousa, Fernandes & Ramos (2006) Protein-Ligand Docking: Current Status and Future Challenges Proteins, 65:15-26
[8] Hu, Z., Southerland, W. (2007) WinDock: structure-based drug discovery on Windowsbased PCs . J Comput Chem 28: 2347-2351.
[9] Vaqu, M., Arola, A., Aliagas, C., Pujadas, G. (2006) BDT: an easy-to-use front end application for automation of massive docking tasks and complex docking strategies with AutoDock . Bioinformatics 22: 1803-1804.
[10] Friesner, R.A., Banks, J.L., Murphy, R.B., Halgren, T.A., Klicic, J.J., et al. (2004) Glide: A New Approach for Rapid, Accurate Docking and Scoring Method and Assessment of Docking Accuracy . J Med Chem 47: 1739.
[11] Bullock, C.W., Jacob, R.B., McDougal, O.M., Hampikian, G., Andersen, T. (2010) Dockomatic- automated ligand creation and docking. BMC Research Notes 3.
[12] Jacob, R.B., Bullock, C.W., Andersen, T., McDougal, O.M. (2011) DockoMatic: Automated peptide analog creation for high throughput virtual screening . J Comput Chem 32: 2936- 2941.
[13] The Open Babel Package. (2011) Version 2.2.3. Available: http://www.openbabel.org. Accessed: December 2011.
[14] Xu, J. Research in Computational Molecular Biology. Miyano S, Mesirov J, Kasif S, Istrail S, Pevzner P, Waterman M, editors. Springer Berlin; Heidelberg: 2005. pp. 423-439.
[15] Xu, J., Berger B. J ACM. 2006;53(4):533-557.
[16] Fratiglioni, L. and Wang, H.X. Smoking and Parkinsons and Alzheimers disease: review of the epidemiological studies. Beh Brain Res 113(1-2), 117-120 (2000) doi:10.1016/S0166-4328(00)00206-0
[17] Morens, D.M., Davis, J.W., Grandinetti, A., Ross, G.W., Popper, J.S., and White, L.R. Epidemiologic observations on Parkinsons disease: incidence and mortality in a prospective study of middle-aged men. Neurology 46(4), 1044
1050 (1996)
[18] Allam, M.F., Campbell, M.J., Hofman, A., Del Castillo, A.S., Fernandez-Crehuet Navajas, R. Smoking and Parkinsons disease: systematic review of prospective studies. Movement Disorders 19(6), 614-621 (2004)
[19] Perry, E.K., Martin-Ruiz, C.M., Court, J.A. Nicotinic receptor subtypes in human brain related to aging and dementia . (Review) (52 refs). Alcohol 24(2), 63-68 (2001)
[20] Levin, E.D., McClernon, F.J., Rezvani, A.H. Nicotinic e ects on cognitive function: behavioral characterization, pharmacological speci cation, and anatomic localization . Psychopharmacology 184(3-4), 523-539 (2006)
[21] Picciotto, M.R, Zoli, M. Neuroprotection via nAChRs: the role of nAChRs in neurodegenerative disorders such as Alzheimers and Parkinsons disease . Frontiers in Bioscience 13, 492-504, January 1, 2008
[22] Cartier, G.E., Yoshikami, D., Gray, W.R., Luo, S., Olivera, B.M., McIntosh, J.M. (1996) A new-conotoxin which targets 3 2 nicotinic acetylcholine receptors. J Biol Chem 271:7522-7528
[23] McIntosh, J.M., Azam, L., Staheli, S., Dowell, C., Lindstrom. J.M., Kuryatov, A., Garrett, J.E., Marks, M.J., Whiteaker, P. Analogs of alpha-conotoxin MII are selective for alpha6-containing nicotinic acetylcholine receptors . Mol Pharmacol. 2004 Apr;65(4):944-52.
[24] Salminen, O., Drapeau, J.A, McIntosh, J.M., Collins, A.C., Marks, M.J., Grady, S.R. Pharmacology of-Conotoxin MII-Sensitive Subtypes of Nicotinic Acetylcholine Receptors Isolated by Breeding of Null Mutant Mice . Molecular Pharmacology June 2007 vol. 71 no. 6 1563-1571
[25] Whiteaker P., McIntosh J.M., Luo S., Collins A.C., Marks M.J. 125I-alpha conotoxin MII identi es a novel nicotinic acetylcholine receptor population in mouse brain. Mol Pharmacol. 2000 May;57(5):913-25.
[26] Bordia, T., Grady, S.R., McIntosh, J.M., Quik, M. (2007) Nigrostriatal damage preferentially decreases a subpopulation of 6 2 nAChRs in mouse, monkey, and Parkinsons disease striatum. Mol Pharmacol 72:52-61
[27] Somisetti V.S, Roberts, J., Bharadwaj, V.S., Slingsby, J.G., Rohleder, C., Mallory, C., Groome, J.R., McDougal, O.M., Maupin, C.M. ChemBioChem, Acetycholine Promotes Binding of alpha-Conotoxin MII for a3b2 Nicotinic Acetylcholine Receptors 15, 413-424 (2014).
[28] Plewczynski, D. Virtual High Throughput Screening Using Combined Random Forest and Flexible Docking . Combinatorial chemistry & High Throughput Screening, 2009, (1386-2073), 12 (5), p. 484.
[29] Svetnik, V., Liaw, A., Tong, C., Culberson, J.C., Sheridan, R.P., Feuston, B.P. J. Chem. Inf. Comput. Sci., 2003, 43, 1947-1958.
[30] Svetnik, V., Liaw, A., Tong, C., Wang, T. Multiple Classi er Systems; Proceed ings 2004; pp. 334-343.
[31] Cherkasov, A., Ban, F.Q., Li, Y., Fallahi, M., Hammond, G.L. J. Med. Chem., 2006, 49, 7466-7478.
[32] Cherkasov, A., Curr. Comput-Aided Drug Des., 2005, 1, 21-42.
[33] Ma, X.H. Comparative Analysis of Machine Learning Methods in Ligand-Based Virtual Screening of Large Compound Libraries . Combinatorial chemistry & High Throughput Screening, 2009, (1386-2073), 12 (4), p. 344.
[34] Melville, J.L., Burke, E.K., Hirst, J.D. Machine Learning in Virtual Screening . Combinatorial Chemistry & High Throughput Screening, 2009, I2, 332-343.
[35] Sheridan, P., Robert and Kearsley, K. Simon. Using a Genetic Algorithm to Suggest Combinatorial Libraries . 1994. J. Chem. Inf. Comput. Sci, 1995, 35, 310-320.
[36] Sheridan, P., Robert, S.F., Sonia, P., Kearsley, K.S. Designing Targeted Li braries with Genetic Algorithms . 2000. Journal of Molecular Graphics and Modelling 2000, 18, 320-334.
[37] Gillet, V.J., Willett, P., Bradshaw, J. Selecting combinatorial libraries to optimize diversity and physical properties . J. Chem. Inf. Comput. Sci. 1999, 39, 167-177.
[38] Valler, M.J., Green, D. Diversity screening versus focused screening in drug discovery . Drug Discovery Today 2000, 5, 286-293.
[39] Martin, E.J., Crichlow, R.W. Beyond mere diversity: tailoring combinatorial libraries for drug discovery . J. Comb. Chem. 1999, 1, 32-45.
[40] Fonseca, C.M., Fleming, P.J. An overview of evolutionary algorithms in multiobjective optimization . In EVolutionary Computation; De Jong, K., Ed.; Massachusetts Institute of Technology: Cambridge, 1995; Vol. 3, No. 1, pp 1-16.
[41] Gillet, V.J., Khatib, W., Willett, P., Fleming, P.J., Green, D.V.S. Combinatorial Library Design Using a Multiobjective Genetic Algorithm. 2001. J. Chem. Inf. Comput. Sci. 2002, 42, 375-385.
[42] Gillet V.J., Willett P., Fleming P.J., Green D.V. Designing focused libraries using MoSELECT. J Mol Graph Model. 2002 Jun;20(6):491-8.
[43] Fontaine F., Bolton E., Borodina Y., Bryant S.H. Fast 3D shape screening of large chemical databases through alignment-recycling . Chem Cent J. 2007;1:12. doi: 10.1186/1752-153X-1-12
[44] Inokuchi, A., Washio, T., Nishimura, K., Motoda, H. A Fast Algorithm for Mining Frequent Connected Subgraphs . IBM Research, Tokyo Research Laboratory, 2002.
[45] Cao, Y., Jiang, T., Girke, T., A maximum common substructure-based algorithm for searching and predicting drug-like compounds. Bioinformatics (2008) 24 (13): 366-374
[46] Ralaivolaa, L., Swamidassa, S.J., Saigoa, H., Baldi, P. Graph kernels for chemical informatics . Neural Networks,Volume 18, Issue 8, October 2005, Pages 1093-1110
[47] Friehlich, H., Wegner, J.K., Zell, A. Assignment Kernels For Chemical Com pounds . International Joint Conference on Neural Networks 2005 (IJCNN05), 2005, 913-918.
[48] Freyhult, E.K., Andersson, K., Gustafsson, M.G. (April 2003). Structural Modeling Extends QSAR Analysis of Antibody-Lysozyme Interactions to 3D-QSAR. Biophysical Journal 84 (4): 2264-72.
[49] Dearden, J.C. (2003). In silico prediction of drug toxicity. Journal of Computer aided Molecular Design 17 (2-4): 119-27.
[50] Osada, R., Funkhouser, T., Chazelle, B., DobKin, D. Shape Distributions. ACM Transactions on Graphics, Vol. 21, No. 4, October 2002, Pages 807-832.
[51] Zhou, Y., Zhang, K., Ma, Y. 3D protein structure similarity comparison using a shape distribution method . Information Technology and Applications in Biomedicine, 2008. May 2008, 233-236.
[52] Bolton, E., Kim, S., Bryant, S., PubChem3D: Similar conformers . Journal of Cheminformatics, 2011. 3:13.
APPENDIX A
DISTRIBUTION TESTS
The calcDist Test() function (below) was used to assess the similarity of shape-based signatures. Since each signature was a xed-size histogram, signatures were represented as an array of doubles. The calcDistTest() function was built to work with
one of four metrics, and the implementations of those metrics follow the code for calcDistTest().
An experiment was performed to compare the performance of the shape distribution approach, with each of the 4 distribution tests, to the results reported by Bolton et al. on a 3-D conformer search of PubChem Compound [52]. To set up
the experiment, a set of 16 molecules was selected from the PubChem Compound database. 8 of the molecules, set Pos, were ligands of prostaglandin synthase and therefore had established similar bioactivity. These were the ligands reported on by Bolton et al. While shape Tanimotos have an established threshold for similarity (.8- .85), our approach did not. As a result, we also included a set of 8 molecules, Neg, which were selected to be dissimilar to each other. Its use is explained below. The pairwise similarity between all 16 molecules was assessed using each of the 4 implemented distribution tests. A threshold was used so that the tests could act as classifiers. That is, if test(molamolb) > THRESHOLD, then mola would be considered similar to molb. The ideal classification for the 16 molecules is given by Equation A.1. The actual classi cation for all 5 tests (the 4 implemented tests as well as the results reported by Bolton et al. for the Shape Tanimoto) are given in Table A.1. In the experiments, the THRESHOLD was set so that there was no more than 1 false positive.
test(xy) = { similar if x Pos&y Pos (A.1)
{notsimilar if x Neg&y Neg
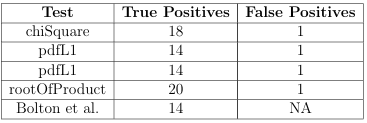
Table A.1: Distribution Test results.
As can be seen, the shape distribution approach compared favorably to the techniques used by PubChem 3D.
public static double calcDistTest(double[] dist1, double[] dist2, String dtest) {
int x;
double sum = 0.0;
if (dist1.length != dist2.length){
sum = 0.0;
} else if (dtest.equals(“chiSquare”)) {
for (x = 0; x < dist1.length; x++){
sum += chiSquare(dist1[x], dist2[x]);
}
sum /= 2.0;
} else if (dtest.equals(“pdfL1”)) {
for (x = 0; x < dist1.length; x++){
sum += pdfL1(dist1[x], dist2[x]);
}
sum /= 2.0;
} else if (dtest.equals(“pdfL2”)) {
for (x = 0; x < dist1.length; x++){
sum += pdfL2(dist1[x], dist2[x]);
}
sum = Math.sqrt(sum);
} else if (dtest.equals(“rootOfProduct”)) {
for (x = 0; x < dist1.length; x++){
sum += rootOfProduct(dist1[x], dist2[x]);
}
sum = 1- sum;
}
return sum;
Figure A.1: Function to compare distributions using the test arguments
public static double chiSquare(double a, double b) {
double result = 0.0;
if ((a + b) != 0.0){
result = Math.pow(a- b,2) / (a + b);
}
return result;
}
public static double pdfL1(double a, double b) {
return Math.abs(a-b);
}
public static double pdfL2(double a, double b) {
return Math.pow(a- b,2);
}
public static double rootOfProduct(double a, double b) {
return Math.sqrt(a * b);
}
Figure A.2: Code for distribution tests
APPENDIX B
K-MEANS CLUSTERING
The Sim Searcher module uses N-level, K-means clustering to reduce the time required for database searches. K-means clustering is an iterative clustering algorithm that partitions a set of data points by placing K center points and adjusting their locations until an optimal arrangement is found. An arrangement is considered optimal if the sum of the distances between each data point and the cluster center closest to it is minimized. However, our version of K-means clustering iterates for a set number of cycles before stopping. At each iteration, a cluster center is moved to the average coordinates of all the points that were in the cluster during the previous round.
B.1 In-Memory Clustering
When all the data points can be placed into main memory, algorithm 6 can be used to perform N-level, K-means clustering by using Algorithm 8 as KMeans Cluster(DB).
B.2 Big Data Style
When all the data points cannot be placed into main memory, a different algorithm needs to be used. In this case, algorithm 9 needs to be used. This algorithm assumes a parallel computing infrastructure, and the parameter cores is used to specify the number of processes to spawn during each iteration.
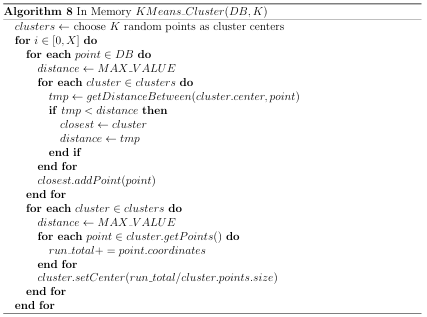
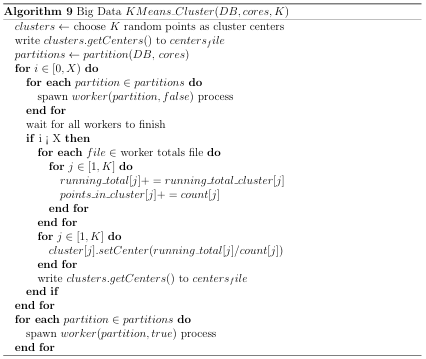
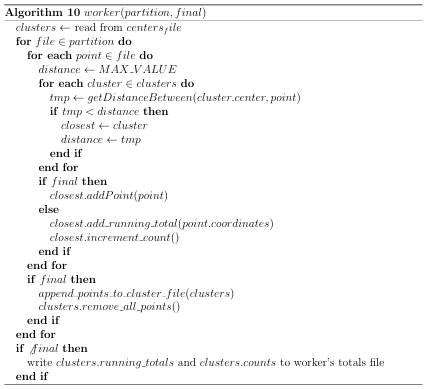
APPENDIX C
PHARMACOPHORE-BASED SIMILARITY METRIC
Phar macophore (feature) based similarity is another popular estimator of bioactivity similarity. As such, a rotationally invariant function was developed to generate a feature-based signature for a molecule, assuming a rigid structure.
A molecules data le contains information on atom locations, charge, and connectivity, so simple graph traversal techniques can be used to determine the existence of features within a molecule. For the algorithms in this section, we assume that a
function parseFeatures() exists that returns the features of the argument molecule. Each feature has a type (e.g., ring, cation) and a location (set of (x,y,z) coordinates), and the location of a composite entity (e.g., the molecule, a ring) is considered to be the average location of its atoms. The feature-based signature generation function is shown in Algorithm 11. The ID (its CID in the case of PubChem Compound) and its features are parsed from a data le. Next, every feature is cast as a typed vector originating at the molecules center. Finally, a 4-tuple (see Algorithm 12) is created for every pair of typed vectors in the molecule. The 4-tuple contains the type of both of the typed vectors as well as their magnitude di erence and the angle between them.
A custom function was designed to map two feature-based signatures, s1 s2 to a number sim [01]. Before describing the function, we note that a signature is a
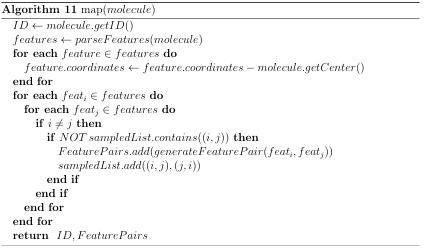
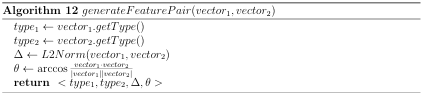
collection of FeaturePairs. Now, let and be any positive integer. The metric is:
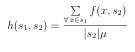
(C.1)
where
f(xs2) = MAX(g(xy)) (C.2)
and where y s2. We also note that each 4-tuple in s2 is used at most once at the in calculating the similarity between a 4-tuple:
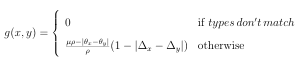
(C.3)
In other words, the function computes the similarity between two signatures by summing the similarity between the most similar FeaturePairs in each signature. Feature Pair similarity is 0 if the feature types di er; otherwise, it is inversely proportional to the difference in the angles and magnitudes. The technique has the following shortcomings:
1. There is no defined average value for a collection of pharmacophore signatures, so K-means clustering is unusable and queries require too many similarity computations.
2. The signature generation assumes a rigid structure, which is inaccurate.
3. The method seems to classify small molecules in a manner similar to shape-based similarity, so the methods do not complement each other well.